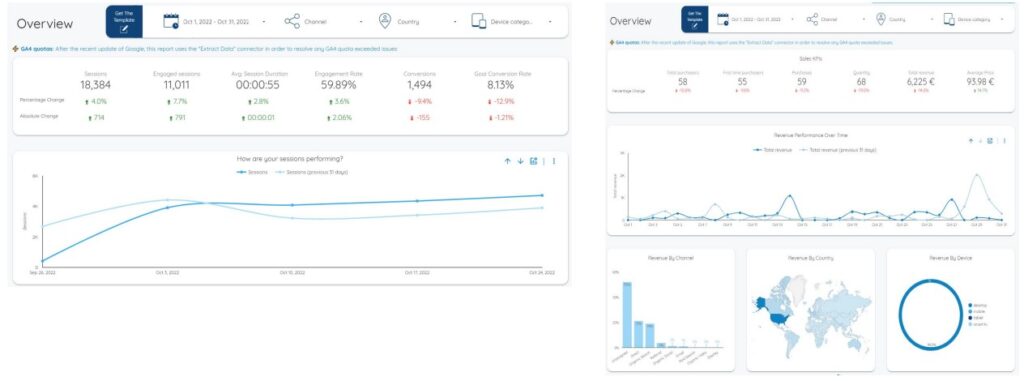
When I first delved into the realm of business dashboards, I stumbled upon Google Data Studio. Its ease of use and versatility made it a game-changer for a newcomer like me. If you’re a budding startup exploring Business Intelligence, Google Data Studio stands out with its user-friendly interface, free pricing, and seamless integration with Google Analytics.
Before diving into creating dashboards, it’s pivotal to comprehend their categories and functionality. Here are the four major dashboard types based on my experience:
- Management Dashboard:
- The Challenge: In many CRM or Project Management systems, information sprawls across various apps. Navigating through them can be cumbersome, leading users to devise spreadsheets or custom tools for a consolidated view. However, this workaround might jeopardize data entry, especially in small firms where strict business rules are harder to enforce.
- The Solution: Connect the CRM/Project Management system to a SQL database to amalgamate data from disparate tables. The dashboard, which draws from this unified data source, can be an invaluable tool for daily decision-making, offering insights through intuitive visualizations.
- The Impact: Such dashboards, focused on short-term planning, empower both users and middle managers. They aid in organizing tasks and ensuring better workload distribution.
- Analysis Dashboard:
- The Premise: Efficient management dashboards can lead to improved productivity and data quality.
- The Process: Leveraging enhanced data, organizations can delve into descriptive, predictive, and prescriptive analytics. These insights can drive better market targeting, vendor selections, and hiring decisions.
- User Engagement Dashboard:
- The Need: Ensuring the effective use of new dashboards is vital.
- The Tool: Platforms like Google Analytics offer insights into dashboard usage patterns, shedding light on user adaptability.
- The Evaluation: Monitoring dashboard engagement can guide user training and further dashboard enhancements. Establishing benchmarks for expected usage can also be valuable.
- Strategy/Executive Dashboard:
- The Purpose: Tailored for leadership, these dashboards contain sensitive data pivotal for company direction.
- The Insights: Financial forecasts, revenue projections, and profitability analyses offer the leadership team a comprehensive overview.
- The Caveat: High data integrity is crucial; erroneous data could lead to misguided decisions with wide-reaching consequences.
The Ideal Deployment Sequence:
- Begin with Management Dashboards to streamline daily operations. Positive user feedback is indicative of improved data input.
- Transition to Analytical Dashboards for a deeper understanding of trends and process improvements.
- Concurrently, monitor User Engagement Dashboards to gauge adaptability.
- Culminate with Strategy Dashboards, ensuring that prior dashboards are well-integrated and data integrity is assured.
In conclusion, dashboards, when adeptly integrated, can dramatically boost organizational efficiency, transparency, and accountability. Relying purely on intuition isn’t tenable as businesses scale. A data-driven culture is paramount, with dashboards illuminating the path ahead, ensuring clear visibility and facilitating effective decision-making.
Author: Pranav Modak
